

AAPL Stock: Buy, Sell or Hold in June 2026
The Apple stock just pulled back from highs. Here’s whether new buyers should wait and what current holders should do now.

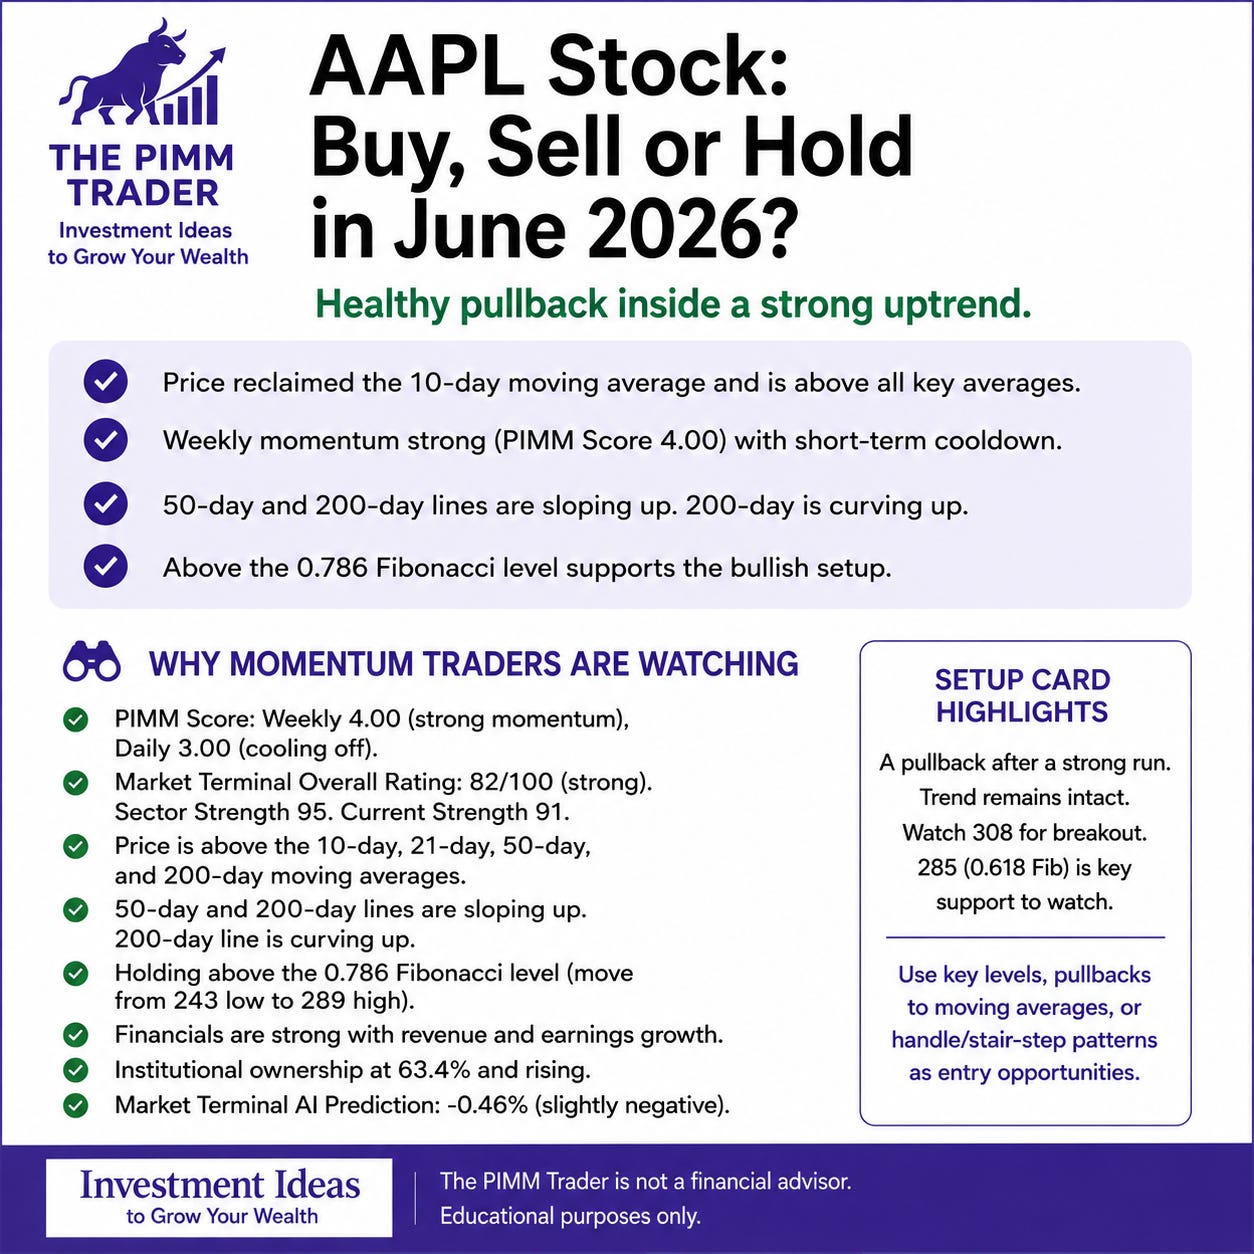
The bottom line
New positions can be considered here, with the understanding that this is not the cleanest low risk entry.
The pullback looks like a normal shakeout rather than a trend change.
Existing positions can hold.
The bigger trend is still intact.
The stock just reclaimed a key short term level.
What is the PIMM Score saying?
The PIMM Score is mixed depending on the timeframe.
On the weekly chart, the score sits at 4.
A score of 4 or 5 means strong momentum, so the bigger picture trend is healthy.
On the daily chart, the score has dropped to 3.
This tells us short term momentum cooled off after the recent pullback.
When the weekly score is strong but the daily score is weak.
Tt usually means the stock is taking a breather inside a bigger uptrend.
What is the Market Terminal Score saying?
The Market Terminal Overall Rating for AAPL is 82 out of 100.
A score of 80 or above is considered strong.
Sector Strength comes in even higher at 95, and Current Strength sits at 91.
These numbers tell us Apple is outperforming its peers and showing real strength under the hood.
Try Market Terminal for free.
Tell them The PIMM Trader sent you.
Is the price above its key moving averages?
Price closed back above the 10-day moving average on Thursday.
It is also trading above the 21-day, the 50-day, and the 200-day moving averages.
That is a clean sweep across every major moving average.
This tells us the pullback did not do lasting damage to the trend.
Are the moving averages sloping up?
The 50-day line is sloping up.
The 200-day line is sloping up as well, which supports the idea that the longer term trend remains intact.
The 10-day line had rolled over during the pullback, which is normal after a sharp drop.
Reclaiming the 10-day on Thursday is an early sign that short term momentum is turning back up.
Is the 200-day line curving up?
Yes, the 200-day line is curving up.
This is a strong sign, since an upward curving 200-day line points to full momentum building underneath the stock.
It tells us the longer term buyers are still in control even with the short term pullback.
What do the candles tell us?
AAPL had a strong gap up and a series of long green candles heading into early June.
That move pushed the stock from the 270 area all the way above 310.
After that, AAPL printed a long red candle that erased a big chunk of those gains in a single session.
That kind of sharp reversal candle after a big run up is a classic sign of short term weakness.
The stock has since tried to stabilize and is chopping around the 296 to 298 area.
What do the Fibonacci levels tell us?
The pullback looks normal within a healthy trend rather than a breakdown.
What do the financials show?
Apple’s total revenue grew to $416 billion, up 6% from the prior year.
Net income jumped 19% to $112 billion.
Free cash flow came in at $98.8 billion, and the company is still generating well over $100 billion in cash from operations every year.
Service revenue keeps climbing too, growing 14% to $109 billion.
These numbers support the case that Apple’s core business remains strong, even when the stock chart gets choppy.
What does institutional ownership tell us?
Institutional ownership in AAPL now stands at 63.4%, up from 60% just two years ago.
The number of institutions holding the stock grew to 6,300, more than double where it stood a few years back.
Total institutional investment has grown to $2.38 trillion.
Big money has been steadily building positions in Apple, which adds confidence to the longer term bullish case.
What does the AI prediction say?
The Market Terminal AI Prediction model is currently showing a slightly negative outlook of -0.46%.
This is a mild signal and does not carry much weight on its own.
Paired with a reclaimed 10-day moving average, it looks more like the model catching up to a pullback that has already started to resolve.
TL;DR
AAPL just had a sharp pullback after a strong run from the 270s to above 310.
The 50-day and 200-day lines are both still sloping up, and price reclaimed the 10-day moving average on Thursday.
That combination points to a healthy pullback rather than a trend change.
A move back above the recent highs near 308 would confirm the uptrend is fully back in gear, while a pullback toward the 0.618 Fibonacci level near 285 would offer a lower risk entry for anyone who missed the move so far.
Existing holders can stay patient and hold through this pullback as long as price stays above the 200-day average.
Disclaimer: The author is not a financial advisor. The information provided herein is not financial advice and should not be construed as such. This content is intended solely for educational purposes. The author will not be held liable if you decide to use this material as a basis for any financial decision-making. Investing involves risk, including the potential loss of your invested capital. Only invest what you are willing and able to lose.