


Apple's Bear Market: Is It Time To Buy?


Bottom Line Up Front: Add AAPL to your watch list because it might start getting out of its bear market soon.
Apple started a bear market on April 25th, 2025.
This was the day the major indices broke their 50-day moving averages.
The stock market proceeded to crash as the tariffs unfolded.
AAPL, major tech stocks and many other stocks crashed with the market.
Many have recovered, but AAPL has not.
Others like NVDA, NFLX, AMZN, META, MSFT have recovered and have broken out of bases.
Yet, AAPL is starting to show signs it might finally get out of its private bear market.
Indicator 1: Downward Trend Lines
AAPL has two downward trend line.
We drew the first trend line by using the peaks on December 26, 2024, and February 25, 2025.
The next one we drew by drawing a line using the peaks of February 25, 2025, and May 14, 2025.
The price has gotten above the second trend line and has stayed above it.
The longer the price stays above the line, the better chance it has to start an uptrend.

Indicator 2: 50-Day Moving Average
The 50-day moving average line tends to be an indicator of bullish or bearish momentum.
The price being above the 50-day is a sign of bullish momentum.
The line sloping upward is also a sign of bullish momentum because the price of the last 50-days keeps going higher.
An average can only go higher when the individual prices are also going higher.
The moving average line is flattening out after several months of a downward slope.
This shows the possibility that the price is dropping less and less and could start going higher and higher.

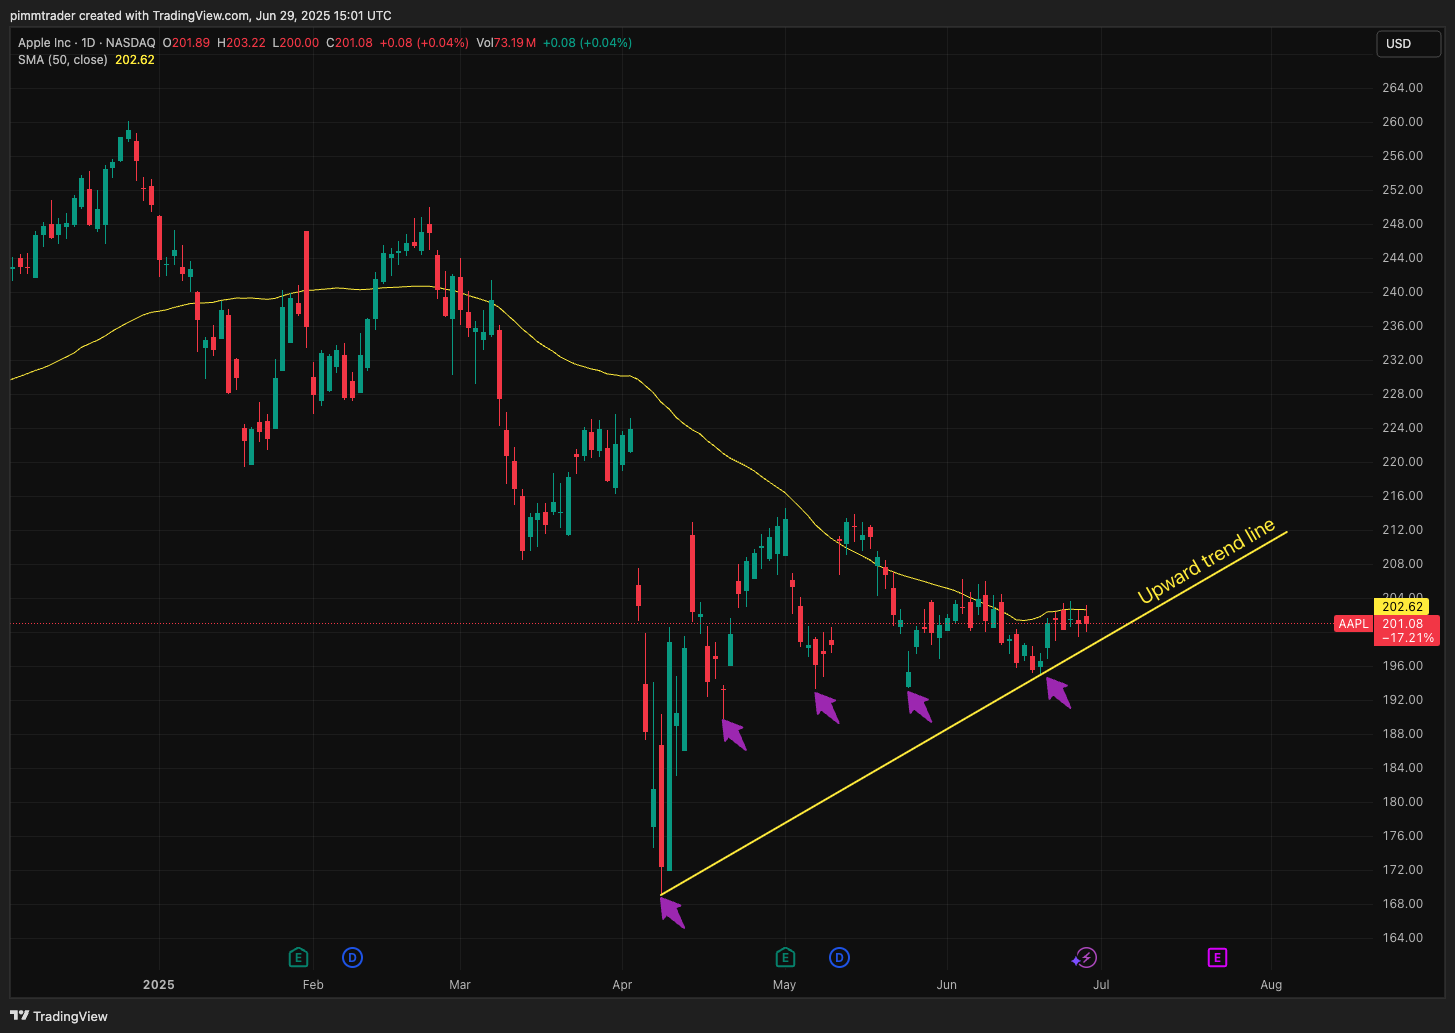
Indicator 3: Upward Trend Line
The stock price will show indicators that it wants to go higher and break out of a bear market.
We should see the price show higher lows.
This means the price will fall but stop falling before it reaches the previous low.
Let’s say the price fell from $100 to $80.
Then it goes up to $85 and falls back down to $82.
It goes up to $90 and falls back down to $84.
Although the price falls, it does not go lower than before.
We are seeing that behavior in AAPL.
We can draw a line to show the upward trend line.
Indicator 4: Parabolic SAR
The parabolic SAR dot is an indicator of support or resistance.
It acts as resistance when the dot is above the price, which means the stock price is struggling to go higher.
It acts as support when the dot is below the price, which means the stock price is struggling to go lower.
Almost two months ago, the weekly stock price broke above the dot.
The stock price has been above the weekly parabolic SAR dot which shows support.

Conclusion
Add AAPL to your watch list.
Indicators show that the price wants to go higher.
As the stock market gets stronger, there is a greater likelihood of AAPL breaking out of its bear market.